![]](/assets/images/2011/12/RoomBoard_SHT11_4_LDRPIR_1.jpg)
After many years I’ve re-discovered electronics as a hobby, thanks to the JeeLabs and Arduino communities.
I’m setting up a small electronics lab with some basic equipment like the Rigol DS1052E oscilloscope (approx. 300 Euros; I “upgraded” mine to the DS1102E firmware to increase the scope’s bandwidth to 100MHz).
One of my first projects is building a Wireless Sensor Network (WSN) to measure humidity, temperature, brightness and motion in several locations at home. The necessary hardware is depicted on the right.
I’ve added a simple resistor ladder network to one of the analog inputs, allowing me to measure battery voltage; these units are supposed to be powered from rechargable batteries for at least a year. Standby power consumption of these devices is in the micro-Amp range; much better than a standard Arduino. The JeeNode comes with an onboard RF12B wireless module (not visible in the picture; it’s below the PIR board) for communications.
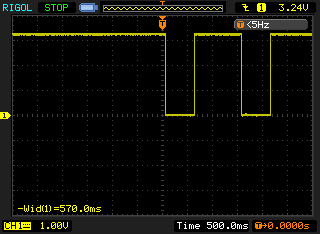
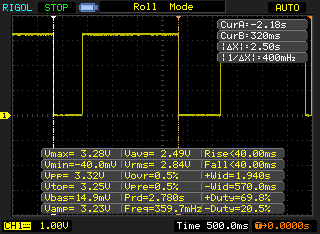
While experimenting with the software, I wanted to take a closer look at the actual PIR sensor output signal. The Rigol oscilloscope has all kinds of handy features that assist in analysing and measuring these signals. It can store screenshots on a USB stick, or be remote controlled from a PC – excellent value for money!


As you can see, the display is only 320 pixels wide (QVGA) but that is enough for my modest needs ;-)
I tried triggering the PIR as short as possible. The PIR open collector output is pulled low (negative edge) if motion is detected. The minimum output pulse width was approx. 570 milliseconds wide. If the sensor sees continuing motion, the output will remain low for that period (at least, in Continuous trigger mode).
The accompanying “sketch” (Arduino-talk for a program that you write) sends out packets at regular intervals (once per minute, or less), containing all the telemetry info. If motion is detected, an interrupt is generated that causes a packet to be sent out immediately.
I modified a receiver “sketch” to decode the telemetry info and generate a human-readable report:
ROOM-18 1695b 221* 1 38% 22.6C 4.638V 0
 -> ack-18
ROOM-25 1695b 21* 0 46% 19.6C 5.180V 0
ROOM-18 1695b 221* 1 38% 22.7C 4.638V 0
 -> ack-18
 ? 17 166 224 91 134 200 17 70 143 23 173 91 150 205 3 49 236 76 147 243 149
 ? 45 230 233 2 36 124 197 34 202 40 8 137 155 8 37 81 182 185 91 22 183
ROOM-18 1695b 221* 0 38% 22.7C 4.638V 0
Here, I have two JeeNodes (ID 18 and 25), each outfitted with a Room Board. The 433MHz band is crowded, so you’ll see spurious traffic (indicated by ‘?’). If a proper Room Node packet is recognized, it is decoded and displayed.
The report indicates the source of the transmission (ROOM-18 or ROOM-25); free RAM (1695 bytes); brightness (0-255); motion (0-1); humidity; temperature and battery voltage. The last “0” is the Low Battery indicator.
Regular transmissions are not acknowledged; it’s no problem if you lose a couple of data points. If the PIR is triggered however, acknowledgements are requested to ensure that the central node registers this event.
I’m still working on the central node software; I’ll probably just parse the data and stick it in a RRD file or database…
Electronics + Software = hours of fun! ;-)